
Pre-requisities
Jaeger
In the microservice architecture, distributed tracing help us understand better when there is performance issue or when failure happens. Jaeger help us enable the distributed tracing with minimal code changes in our application.
Trace & Spans
Trace & Spans are the 2 main blocks of Jaeger. A trace represents a complete flow and the services involved in the flow. A span represents a single unit in a trace, that has a name, a start and end time . A trace has multiple spans.
Jaeger without Istio
Jaeger works by propogating trace headers in the request. At the start of the flow, a trace and span is created. Then the subsequent services in the flow creates a new span and add them to the trace created at the start. Also it is the responsibility of individual services to push the trace & span information to the jaeger service.
In this article, we will see how to use Jaeger that was bundled with istio from a spring-boot application.
Istio simplifies tracing
- Istio installation comes pre-bundled with Jaeger
- The istio envoy sidecar takes care of setting the required request headers to enable tracing
- The istio sidecars are designed to send the trace & span information to the Jaeger
- Supports b3 header propogation
Note: Though Istio simplifies tracing by using the envoy sidecar to create and send span information to Jaeger out of the box, the responsbility lies with the applications to propogate the headers. For example, there are 3 requests coming to a service. All the 3 requests will have their own trace-id. Lets say one of the requests need to call another service. Only the first service knows which trace id the request is associated with. Hence it is the application responsibility to propogate trace headers. More details here.
Demo
Let’s say there are 2 micro-services,
- Demo service 1
- Demo service 2
The call flow is, Demo service 1 -> Demo service 2 -> google.com
In both the demo services pom.xml file add the dependency opentracing-spring-web-starter provides support for propogating the b3 trace headers by injecting the spring boot rest clients such as RestTemplate, WebClient etc.
Demo service 1 controller code,
Demo service 1 properties file
The property spring.application.name is used to set the application name in the jaeger span. We also tell opentracing-web-starter that the request headers will be of b3 format with the property opentracing.jaeger.enable-b3-propagation=true
Demo service 2 controller code,
Demo service 2 properties file
Dockerize the demo service 1 and demo service 2.
Then deploy the services to minikube cluster
Get the istio-ingressgateway url from here. Append /demo1 to the ingress-gatewayurl to access the demo service1. The response from demo service 1 will be like this,
hello1 from demo1 & hello2 from demo2
Open Jaeger UI by running this command
istioctl dashboard jaeger
You will see a single trace when the demo service 1 is selected in the left pane
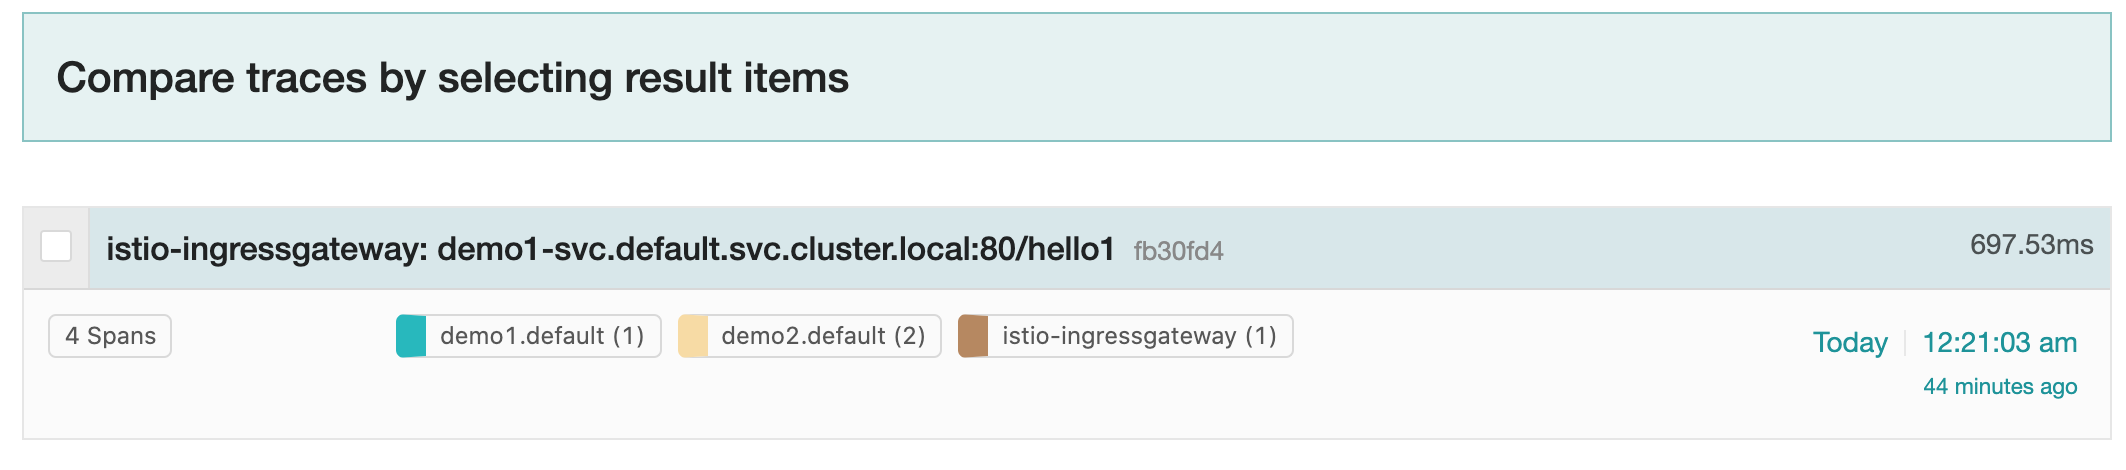
Clicking on the trace, will give a detailed view like this,
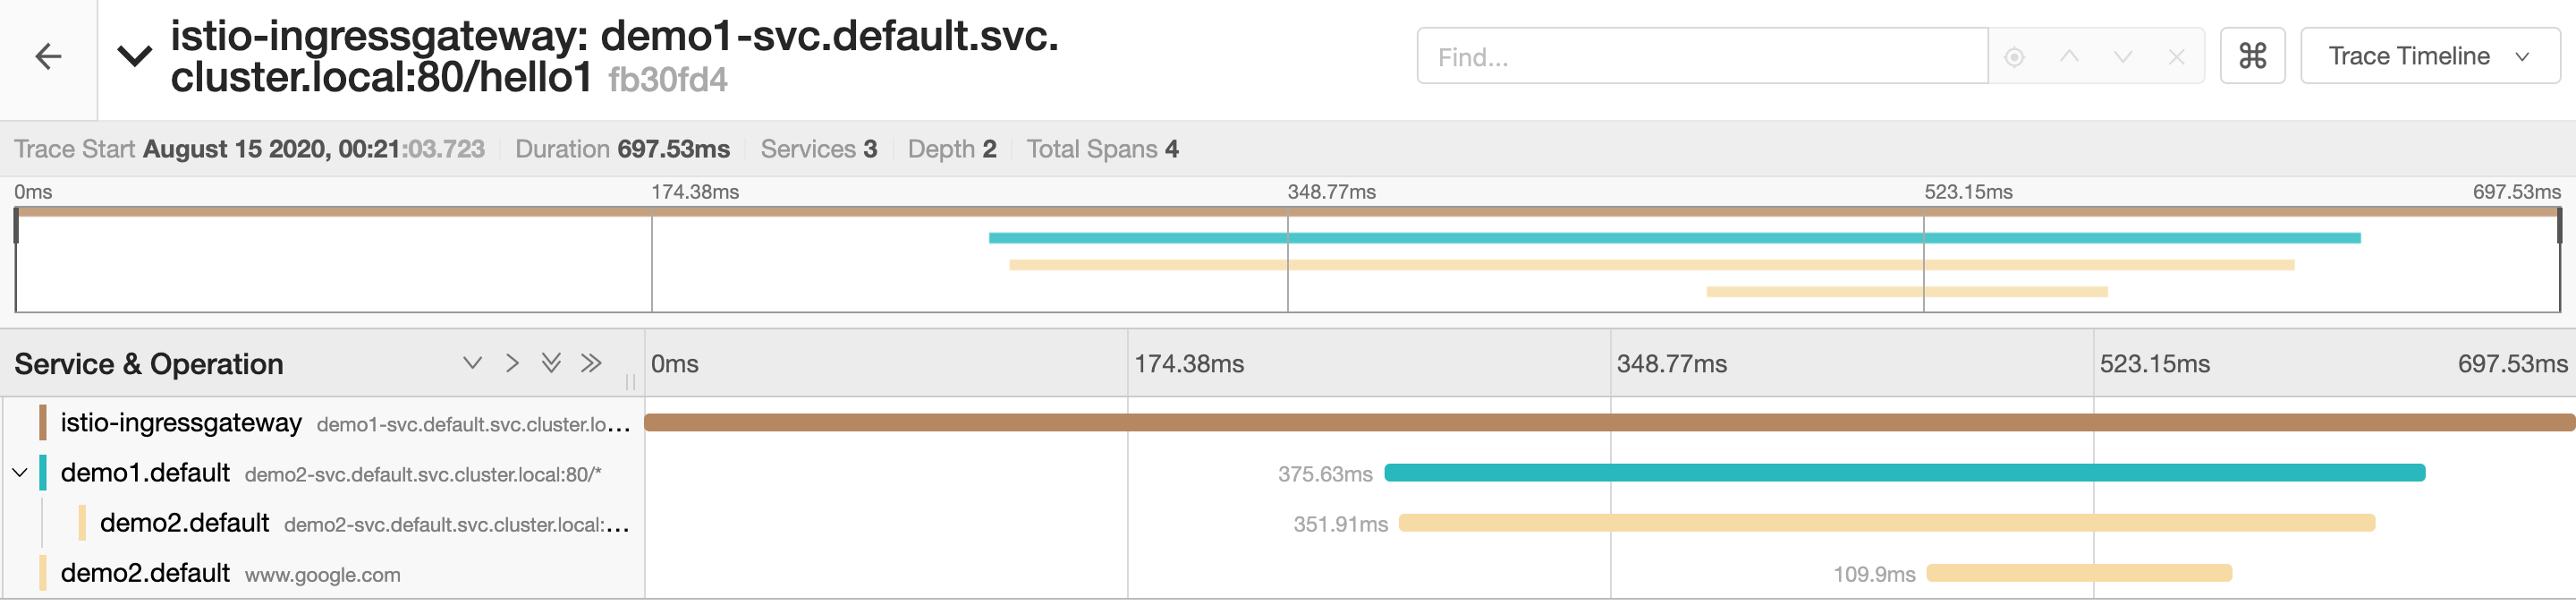
As you see, there are 4 spans. Each span has the timeline that specified how long each span it took. The last span i.e the rest call to www.google.com takes ~109 ms. This way we can easily figure out where is the performace bottleneck or failure.
Thanks for reading!!
Comments