Monitoring is an essential feature once your app starts serving live traffic. With monitoring enabled, it is feasible to configure alerts which in turn triggers a mail notification, for example. The most popular monitoring stack is offered by Prometheus and Grafana. Let’s see how we send the metrics provided by the spring boot actuator to prometheus and create dashboards in Grafana.
The examples mentioned in the post are present in this github repo.
Setup spring boot app
Add actuator dependency to your pom.xml
<dependency>
  <groupId>org.springframework.boot</groupId>
  <artifactId>spring-boot-actuator</artifactId>
</dependency>
This will by default, enable the /actuator/health & /actuator/info endpoint. To expose the metrics provided by actuator in prometheus format, we need to add one more dependency,
<dependency>
  <groupId>io.micrometer</groupId>
  <artifactId>micrometer-registry-prometheus</artifactId>
</dependency>
and add this property in the application.properties file,
management.endpoints.web.exposure.include=health,prometheus
The dependency micrometer-registry-prometheus will expose the metrics provided by actuator in a format consumable by Prometheus.
Once the above changes are done, the metrics in prometheus scrapable format should be accessible in the endpoint /actuator/prometheus. Let’s setup Prometheus & Grafana now to set up the app metrics accessible in Grafana UI dashboard.
Prometheus setup
Prometheus is a monitoring and alerting open-source framework. For our demo purpose, lets use the docker container provided by prometheus. The prometheus config file will look like this
global:
  external_labels:
  monitor: codelab-monitor
  scrape_interval: 15s
scrape_configs:
- job_name: spring-boot-app
  scrape_interval: 5s
  metrics_path: '/actuator/prometheus'
  static_configs:
    - targets:
      - "<application-host-url>:8080"
The above config file just specifies that spring boot ‘app’ listens on port 8080 in the endpoint ‘/actuator/metrics’ and mentions the prometheus server to scrape the metrics every 5s. Once prometheus is started, go to http://localhost:9090/targets and see that the target ‘app’ is UP.
Grafana setup
Grafana is an open source tool to visualise your application metrics by creating dashboards and also provides option for alerting. Let’s get started by starting grafana in docker as mentioned here
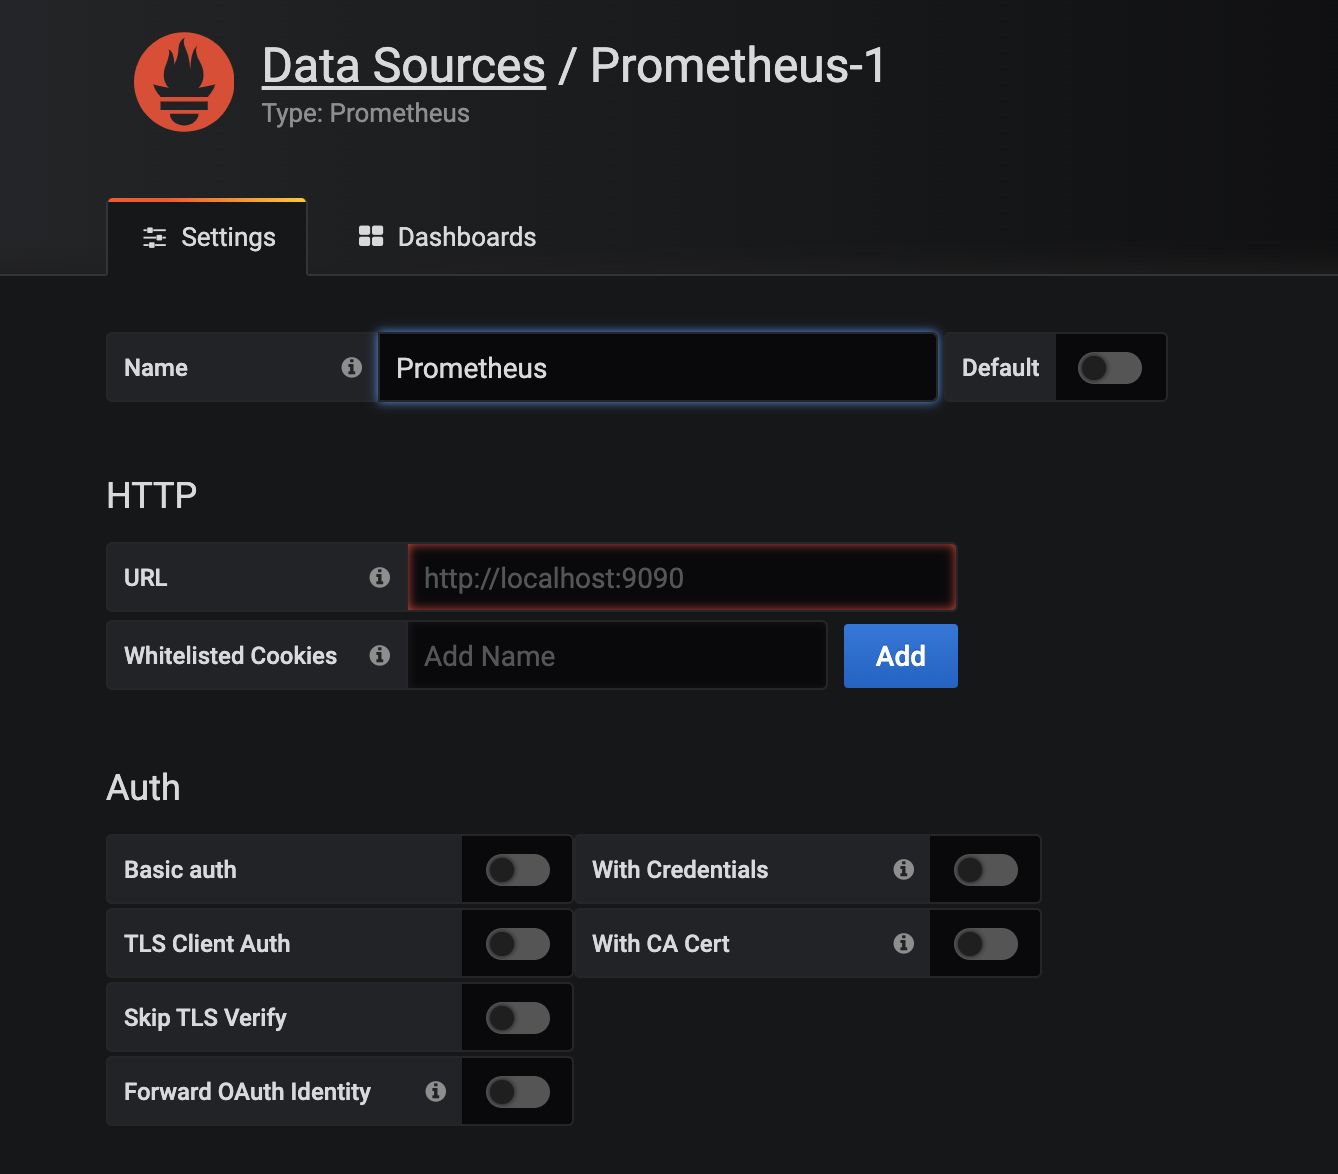
Once the grafana is up and running on http://localhost:3000, create a new data source. Select the type as prometheus and specify the prometheus server url.
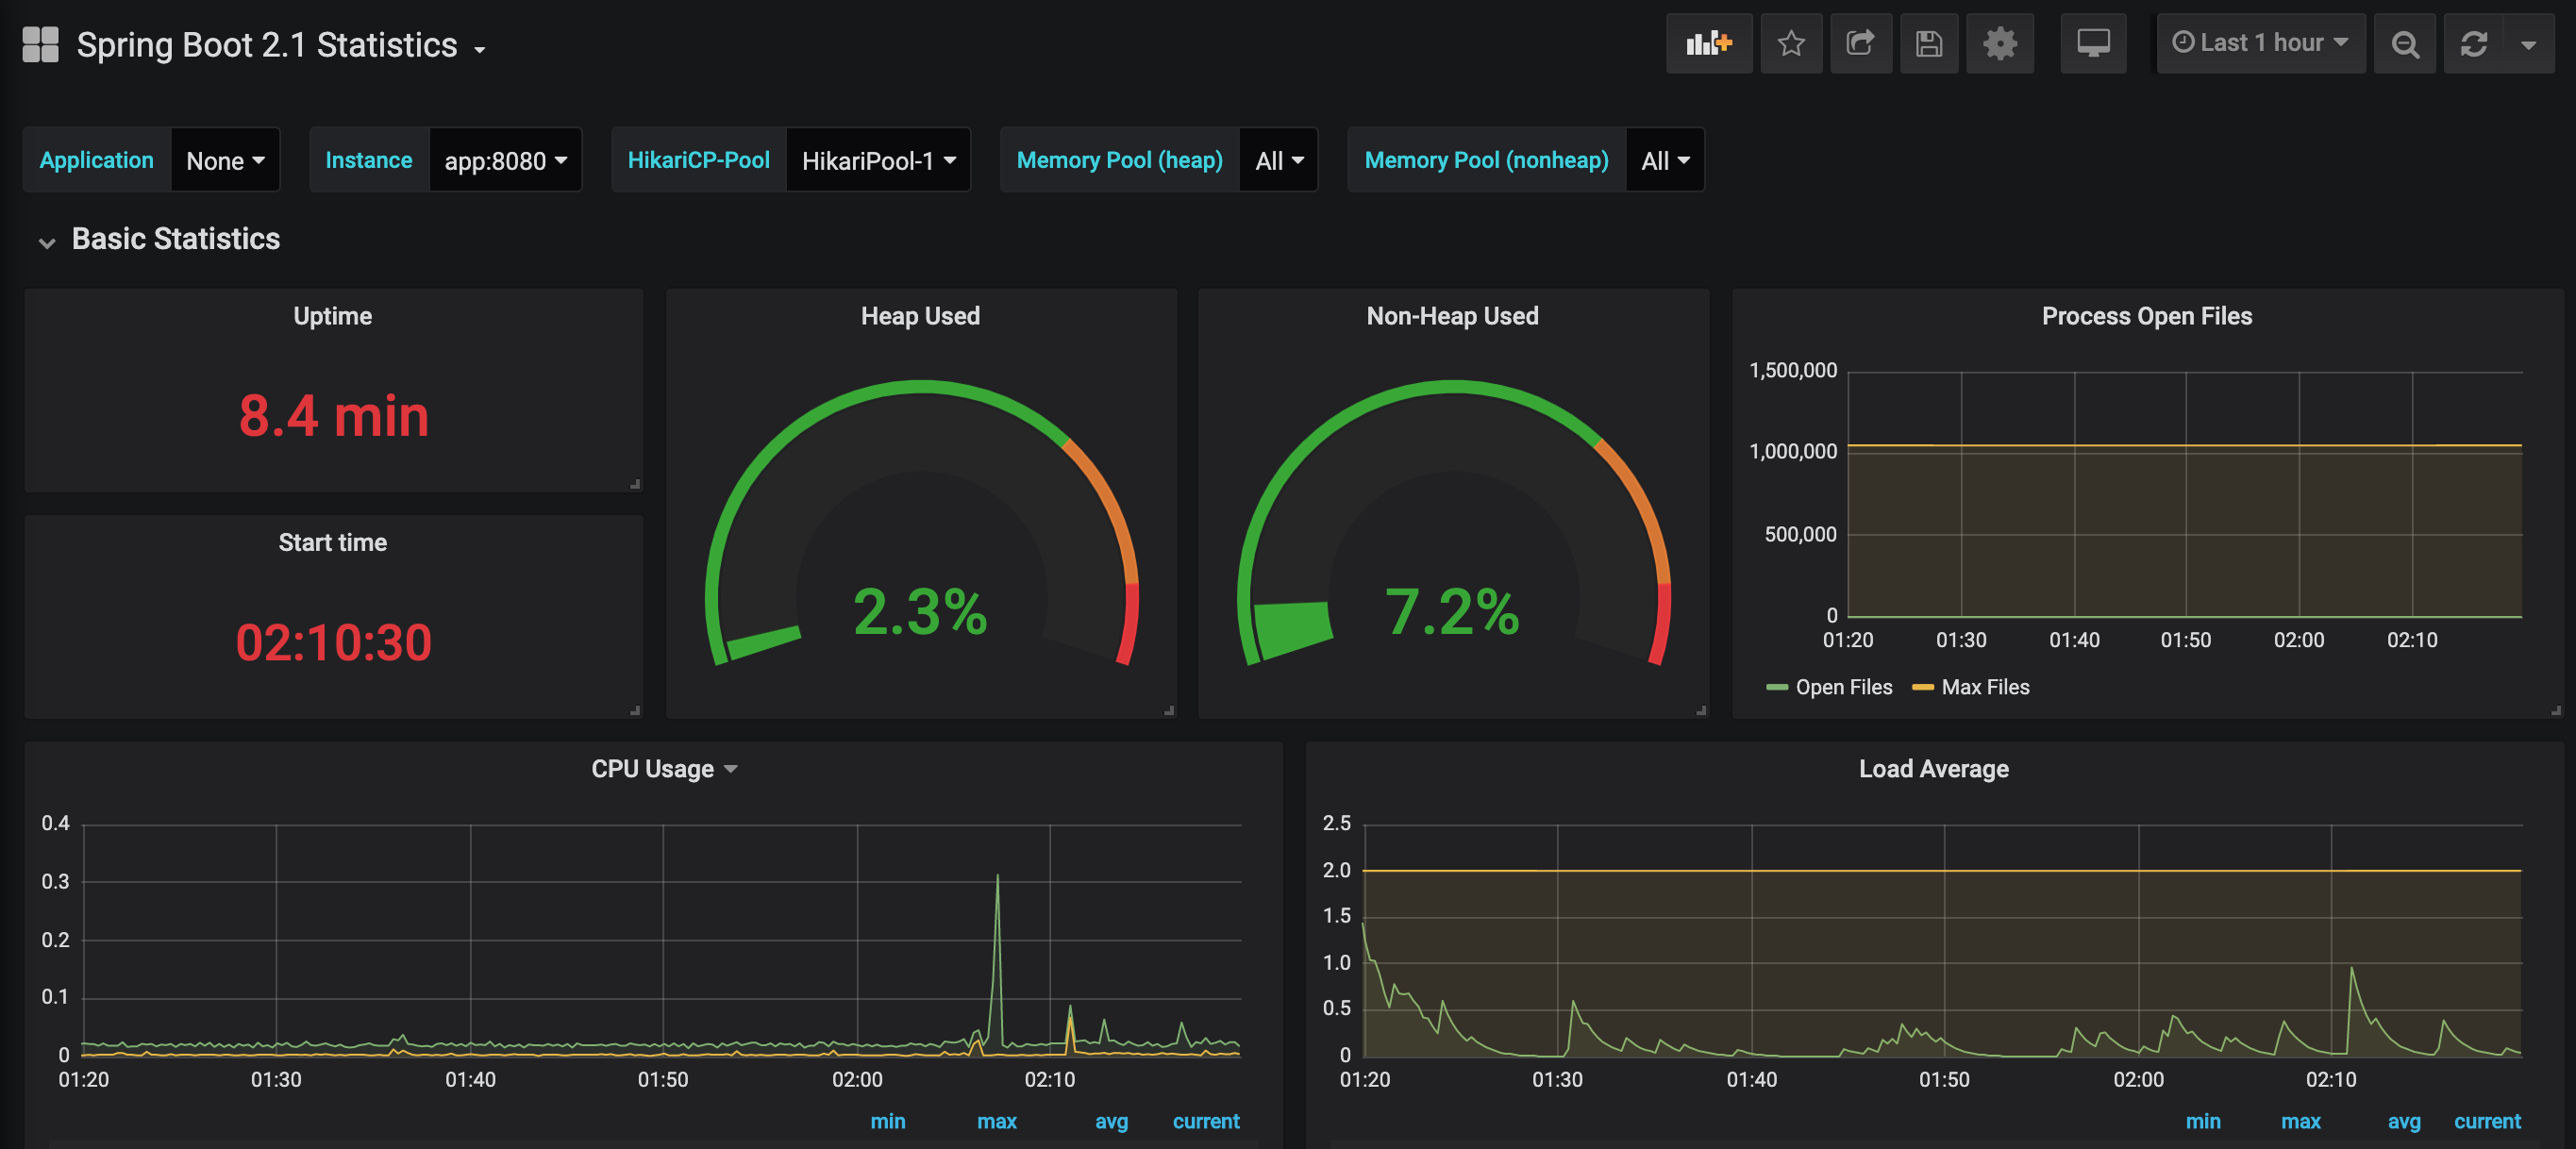
Once the source is defined, we need to create a dashboard using the actuator metrics. It is not necessary that we need to create a dashboard from scratch. We can also import a lot of dashboards that were built by community and approved. I found a few dashboards built for spring boot, actuator & prometheus combination. I found this dashboard worked for me.


Comments